Debugging Rust Cortex-M with VS Code: Take 2
Posted by Christopher J. McClellan in Programming on December 31, 2019
Last time, I wrote about how to configure VS Code to debug Rust Cortex-M programs, but you know what’s better than writing documentation for how to do a thing?
Automating it.
I’m very happy to announce my PR to add a basic debug configuration for VS Code has been merged into the cortex-m-quickstart template. VS Code is now supported out of the box when you cargo generate a new project. When I say “out of the box”, I really mean “out of the box”. I’ve also added a QEMU configuration, so you can go experiment with debugging embedded Rust with VS Code right now, without any additional hardware.
Setup
First, ensure you’ve installed Rust, the ARM Cortex-M toolchain, QEMU, and OpenOCD.
Then, ensure you’ve installed cargo generate.
$ cargo install cargo-generate
Lastly, install the necessary VS Code plugins.
$ code --install-extension rust-lang.rust
Installing extensions...
Installing extension 'rust-lang.rust' v0.7.0...
Extension 'rust-lang.rust' v0.7.0 was successfully installed.

$ code --install-extension marus25.cortex-debug
Installing extensions...
Installing extension 'marus25.cortex-debug' v0.3.4...
Extension 'marus25.cortex-debug' v0.3.4 was successfully installed.
Now we can generate a new project.
$ cargo generate --git https://github.com/rust-embedded/cortex-m-quickstart --name cortexm-app
🔧   Creating project called `cortexm-app`...
✨   Done! New project created /Users/rubberduck/src/cortexm-app
Let’s go ahead and open it in Code.
$ code cortexm-app
Debugging with QEMU
It is recommended you complete the QEMU section of The Book before moving forward, although, it’s probably not necessary.
- Open
src/main.rsand set a breakpoint. - Go to the debug screen and run the
Debug (QEMU)configuration.
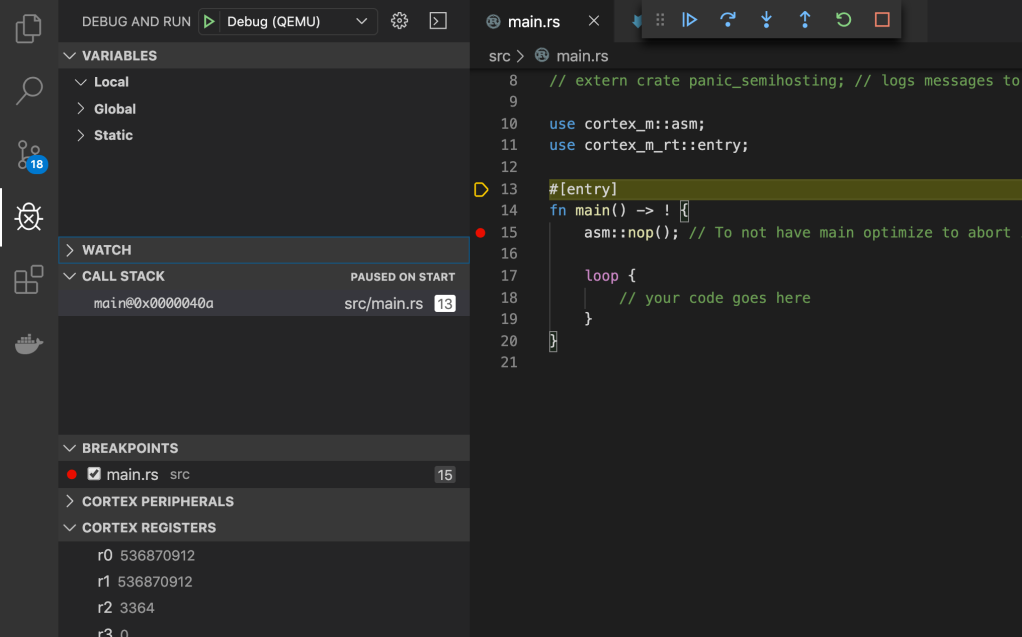
The project will automatically be built targeting the LM3S6965EVB MCU, the resulting executable used to start QEMU, and then break when execution hits the entry point. You can then step through the code as you will.
If you prefer not to break on main, set runToMain to false in the .vscode/launch.json file.
"runToMain": false,
That’s pretty much it. I told you it worked out of the box. Feel free to play with the examples that come with the cortex-m-quickstart template. The easiest thing to do, at the moment, is to copy the code into src/main.rs and run the Debug (QEMU) task. This will ensure the code is built prior to starting the emulator. You could also build the executable from the command line and modify the launch.json file to point to the example, if you wish.
$ cargo build --example hello
{
    //...

    // "executable": "./target/thumbv7m-none-eabi/debug/testapp",
    /* Run `cargo build --example hello` and uncomment this line to run semi-hosting example */
    "executable": "./target/thumbv7m-none-eabi/debug/examples/hello",
},
Currently, the Rust Language Server extension doesn’t directly support building an example, although we could create a new configuration and shell build task that executes the right cargo build command.
I consider this to be an area for improvement in the future but, honestly, it’s a good exercise for the reader. These default configurations aren’t meant to be the “end all, be all”. They’re meant to be a starting point for you to create debug configurations that meet your and your project’s needs.
Debugging on Hardware
Like last time, we’ll be using the STM32F3DISCOVERY board as our hardware.
Before you tackle this section, it is highly recommend you work through doing this from the command line to ensure you’ve installed the tools and properly setup your project. Unlike the QEMU section, debugging on hardware requires we modify a few files. I’ve included a brief summary below, but I really do encourage you to work through this chapter of The Embedded Rust Book first.
In .cargo/config, ensure you’ve set your build target to thumbv7em-none-eabihf.
[build]
target = "thumbv7em-none-eabihf" # Cortex-M4F and Cortex-M7F (with FPU)
Then ensure you have the correct memory layout in the memory.x linker script.
/* Linker script for the STM32F303VCT6 */
MEMORY
{
  /* NOTE 1 K = 1 KiBi = 1024 bytes */
  FLASH : ORIGIN = 0x08000000, LENGTH = 256K
  RAM : ORIGIN = 0x20000000, LENGTH = 40K
}
With that out of the way, we can connect our hardware via USB to the ST-Link port and launch a debug session. This time we’ll use the Debug (OpenOCD) configuration.
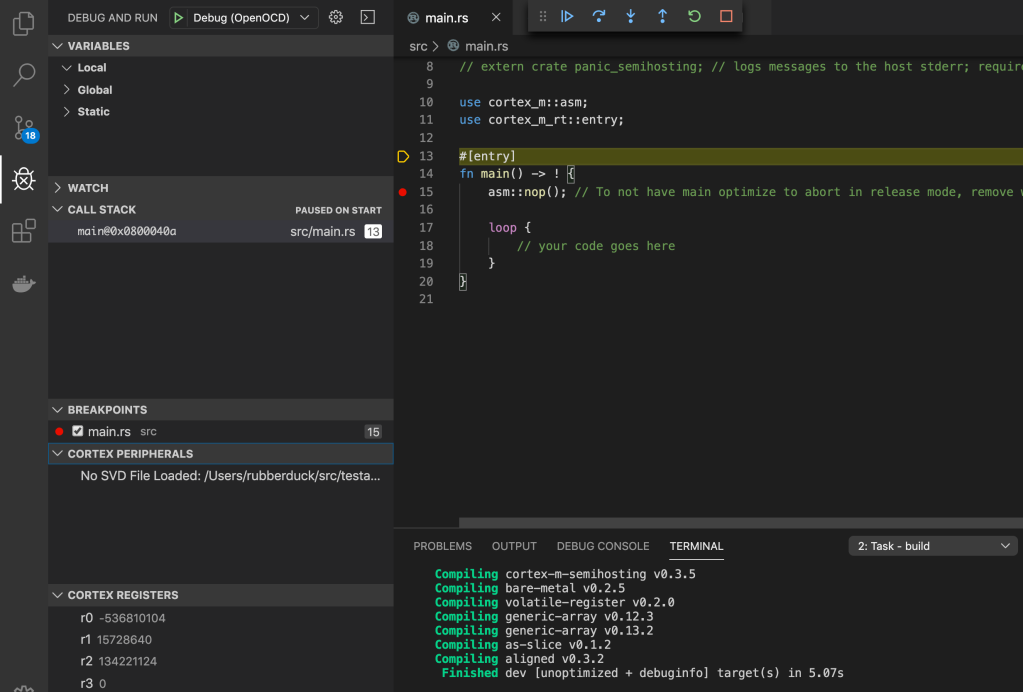
You’ll notice that “Cortex Peripherals” aren’t loading. That’s because, for licensing reasons, we couldn’t include the *.svd file in the quickstart template. If you go to ST’s website for the STM32F3 series, you can find and download the SVD pack (or just download the STM32F3 SVD pack from this link). Once you’ve unzipped the package, just copy the STM32F303.svd file into the .vscode/ directory and start a new debug session. The quickstart is configured to look here for the SVD, so you should now see all of the peripherals loaded into the editor.
Of course, you could keep this file anywhere you like and just modify this line of the .vscode/launch.json file.
"svdFile": "${workspaceRoot}/.vscode/STM32F303.svd",
Personally, I like keeping them in my home directory so I don’t have to keep multiple copies of the SVD on disk.
"svdFile": "${env:HOME}/.svd/en.stm32f3_svd/STM32F3_svd_V1.2/STM32F303.svd",
If you’re working on a shared project though, you may want to use the default location and check the file in. That way, everyone who clones your project has a working configuration as soon as they’ve cloned it.
Which brings us to…
Git
By default, all files in the .vscode/ directory are ignored by Git. There are a number of files that can end up in the .vscode/ directory that shouldn’t be committed, so ignoring the files in this directory as a default is a good idea, but the task.json and launch.json files define build & run configurations that can (in my opinion, should) be shared with anyone cloning the project. They’re not user specific files, so they’re safe to add to your repository and will be tracked by default.
Logging with ITM
Nothing really changes here since last time, so see the logging section of the original post.
Using other hardware
This is where we need to take an actual hard look at the launch.json configuration and you’ll also need a pretty good understanding of the hardware you wish to use, so if you’re happily debugging your STM32F3DISCOVERY, feel free to stop here. However, if you’re looking to setup VS Code for some other board, continue on and I’ll do my best to explain what the different parts of the Debug (OpenOCD) config do. For full documentation, see the Cortex-Debug project site and repository.
For reference, here is the OpenOCD config for the STM32F303.
{
    /* Configuration for the STM32F303 Discovery board */
    "type": "cortex-debug",
    "request": "launch",
    "name": "Debug (OpenOCD)",
    "servertype": "openocd",
    "cwd": "${workspaceRoot}",
    "preLaunchTask": "build",
    "runToMain": true,
    "executable": "./target/thumbv7em-none-eabihf/debug/cortexm-app",
    "device": "STM32F303VCT6",
    "configFiles": [
        "interface/stlink-v2-1.cfg",
        "target/stm32f3x.cfg"
    ],
    "svdFile": "${workspaceRoot}/.vscode/STM32F303.svd",
    "swoConfig": {
        "enabled": true,
        "cpuFrequency": 8000000,
        "swoFrequency": 2000000,
        "source": "probe",
        "decoders": [
            { "type": "console", "label": "ITM", "port": 0 }
        ]
    }
}
Server Type
The Cortex-Debug extension supports a number of different GDB servers. Here, we’re specifying that we’re using OpenOCD.
"servertype": "openocd",
If you’re using a different GDB server, you’ll obviously need to reference the documentation to configure your server and most of the information below will be of questionable value to you.
Device
"device": "STM32F303VCT6",
The device field is used to specify which MCU you’re targeting and is used in conjunction with one of the several Cortex-Debug Device Support Packs. If you’ve installed the right pack and specified a device, the Cortex-Debug extension will use this field to look up the right SVD file for you and you can then omit the svdFile field.
So, technically, in the current configuration, this does nothing but document which microcontroller this config is meant for.
SVD File
"svdFile": "${workspaceRoot}/.vscode/STM32F303.svd",
Specifies where the System View Description for your device is located. As we’ve covered, this allows the Cortex-Debug plugin to load peripherals for your device into the editor. This can be omitted if using a Device Support Pack and device field.
Config Files
"configFiles": [
    "interface/stlink-v2-1.cfg",
    "target/stm32f3x.cfg"
],
This is an array of config files passed to openocd and equivalent to using the -f flag.
openocd \
  -f interface/stlink-v2-1.cfg \
  -f target/stm32f3x.cfg
If you find your openocd installation directory, you will find many common configurations and targets under the share/openocd/scripts/ directory. Specify the correct files for your device here.
SWO Config
"swoConfig": {
    "enabled": true,
    "cpuFrequency": 8000000,
    "swoFrequency": 2000000,
    "source": "probe",
    "decoders": [
        { "type": "console", "label": "ITM", "port": 0 }
    ]
}
This configures the ITM output for the device. The fields you’ll likely need to update here are the cpuFrequency, swoFrequency, and the ITM port. Get any of these wrong and you’ll not see any output in the SWO output of the editor.
Unfortunately, I can’t help you much here. You’ll need to reference your datasheet and schematic for the CPU frequency, as well as know what SWO frequency and port the software is using.
Conclusion
I couldn’t be happier that these configurations were added to the quickstart template. Hopefully, this lowers the barrier just that much more for folks looking to get into embedded Rust. I have high hopes for Rust as an embedded development language over the next decade. I figure the lower the bar to entry is, the more people we can get involved, the more likely it will be that we can develop the ecosystem into something that makes Rust a default choice for systems programming. I know it won’t happen over night, and the languages currently in use aren’t ever going away, but I’m happy to contribute one small piece in the puzzle to a better future for embedded software.
Until next time,
Semper Cogitet
Debugging Rust ARM CortexM Programs with Visual Studio Code
Posted by Christopher J. McClellan in Uncategorized on November 29, 2019
I’ve been toying with embedded Rust off and on for some time now. I picked up one of the STM Discovery boards and it’s been an interesting novelty for me to be able to remotely debug code running on the microcontroller. I’ve never been willing to spring for the external hardware debugger required to do so, but the Discovery has a STLink built into the board. The Rust Embedded and Discovery books have great instructions for remote debugging Rust programs, but rely soley on command line tools for doing so. I like the terminal as much as, if not more, than the next person, but it’s also really nice to be able to set breakpoints and step through code right inside of the editor.
Read the rest of this entry »Using USB with Docker for Mac
Posted by Christopher J. McClellan in DevOps, Programming on April 21, 2019
If you’ve been struggling with this issue and just want an answer, skip to the bottom for the TL;DR. I won’t fault you for it.
Docker is a great tool for deploying web services, but one of my favorite uses for it is standardizing toolchains. Instead of everyone on the team needing to setup their development environments identically, and them keeping them in sync, you define the build tools in a single place, a docker image. Then everyone, including your build server, uses that single pre-packaged image.
Not only is this great for teams, but it’s also fantastic when you have side projects that you only periodically revisit. Without fail, when I come back to some old project, I’ve seen updated my tools for something newer, and I can’t build that old project without either upgrading the project or degrading my tools. Leaving a build tools image behind means I can just pick it up and work on it without spending a day getting back up and running.
It’s not all sunshine and roses though. I went on quite an adventure today. Last year I put on a TDD for Arduino workshop. I had started to create a Docker image for AVR development, but ran into problems when it came time to flash the program to the board. Exposing a USB port to a docker container on Mac isn’t exactly a trivial task (until you know how at least!). For that session we mobbed, so I only had to setup one machine. I just stopped fighting with it and went with a regular install of the tools on my machine.
Recently though, I’ve taken a renewed interest in getting this to work properly. First, I’ve been playing with ARM development, but there’s a bug in AVR and ARM’s compiler packaging that means you can’t have both toolchains installed at the same time. Having these toolchains containerized means I can easily keep both readily available. Secondly, I’m now beginning to build on that workshop to turn it into an “Intro to Bare Metal Programming” course. For that, I really need to be able to hand folks an environment I know works, so we’re not spending more time working kinks out of dev setups than learning. Also, in order to standardize embedded toolchains for a team or client at work, I really need to know how to get USB working on Mac.
How to Change Elixir Log Levels for a Running Application
Posted by Christopher J. McClellan in DevOps, Elixir, Programming on June 2, 2018
Logging is essential to any production system, but it’s also terribly easy to make your logs so noisy they become worthless. That’s why I’m a big fan of carefully specifying the criticality level of everything I log. Not only does it allow us to easily search the logs for potential problems, it allows us to quiet our logs down and raise the signal to noise ratio. In production, I don’t want or need debug level logging… until I do. Thankfully, Elixir makes it easy for us to change what level we’re logging at on the fly.
Let’s say we have a Phoenix website and we want to create a log entry every time we serve the site’s index while we’re developing, but not when we go to production.
require Logger

defmodule LogBlogWeb.PageController do
  use LogBlogWeb, :controller

  def index(conn, _params) do
    Logger.log(:debug, "hello there!")
    render conn, "index.html"
  end
end
By default, a Pheonix app runs with debug logging under the dev configuration and info under the prod config.
# config/dev.exs
config :logger, :console, format: "[$level] $message\n"

# config/prod.exs
config :logger, level: :info
This is great! It’s exactly the behavior we want in our production system. At least, that is, until we need to see the debug information because something is wrong in production.
Or, we would be if it wasn’t for the Erlang VM and iex.
In order to be able to connect to our running system, we need to start the process with a node name. Instead of starting our website with mix phx.server like we normally might, we start it with elixir instead.
MIX_ENV=prod PORT=4000 elixir --name myapp@localhost -S mix phx.server
Now that we have a name for our process, we can use iex to connect to the running process via the --remsh option in a separate shell.
iex --sname debug --remsh "myapp@localhost"

Erlang/OTP 20 [erts-9.2]  [64-bit] [smp:8:8] [ds:8:8:10] [async-threads:10] [hipe] [kernel-poll:false] [dtrace]

Interactive Elixir (1.5.3) - press Ctrl+C to exit (type h() ENTER for help)
iex(myapp@localhost)1>
Finally, now that we have an interactive session established, we can change the Logger configuration to output the debug logs.
iex(myapp@localhost)1> Logger.configure(level: :debug)
:ok
If we check the logs now, we’ll see our debug message.
08:56:34.205 [info] GET /
08:56:34.218 [debug] Processing with LogBlogWeb.PageController.index/2
  Parameters: %{}
  Pipelines: [:browser]
08:56:34.218 [debug] hello there!
08:56:34.227 [info] Sent 200 in 22ms
When we’re done gathering the extra information, we can simply set the level back to info.
iex(myapp@localhost)2> Logger.configure(level: :info)
:ok
And there you have it folks. That’s how you change the log level of your Elixir application without ever taking it offline.
Test Driving Arduino
Posted by Christopher J. McClellan in Programming, tdd on February 16, 2018
I gave a workshop for the Columbus Arduino and Raspberry Pi Enthusiasts (CARPE) Tuesday night. We had a great time and I thought it would be a good idea to share the experience and my motivation creating the workshop here.
The Arduino IDE isn’t what I’d call good. It’s great for someone new to programming or microcontrollers. It gets you from zero to blinking a light in seconds, but lacks a lot of features that seasoned programmers rely on. It has a myriad of problems.
- No file browser.
- No terminal.
- No code navigation (like “Go to declaration”).
- Code is hidden away where it’s hard find and get into source control.
- No way to create automated unit tests.
- Arduino libs aren’t always well behaved (SoftwareSerial and OneWire are notorious for globally disabling interrupts).
A few months ago I set out to see if I could some of these problems. My main goal was to be able to TDD microcontroller code. The secondary goal was to be able to use whichever editor I liked. I figured I would probably need to use a different editor anyway.
How to See Memory and CPU Usage for All Your Docker Containers on CentOS 6
Posted by Christopher J. McClellan in DevOps, Programming on July 22, 2017
I run a bunch of Docker containers on a single CentOS 6 server with a limited amount of memory. (I only recently bumped it from 0.5 to 1 whole whopping gig!) Before I bring another container online, I like to check to see how much room I’ve got. Being the newest versions of Docker aren’t available for CentOS 6, I’m running an ancient version, 1.7 or so. On the new versions of Docker, running docker stats will return statistics about all of your running container, but on old versions, you must pass docker stats a single container id. Here’s a quick one-liner that displays stats for all of your running containers for old versions.
$ docker ps -q | xargs  docker stats --no-stream
CONTAINER           CPU %               MEM USAGE/LIMIT     MEM %               NET I/O
31636c70b372        0.07%               130.8 MB/1.041 GB   12.57%              269.7 kB/262.8 kB
8d184dfbeeaf        0.00%               112.8 MB/1.041 GB   10.84%              45.24 MB/32.66 MB
a63b24fe6099        0.45%               50.09 MB/1.041 GB   4.81%               1.279 GB/1.947 GB
fd1339522e04        0.01%               108.2 MB/1.041 GB   10.40%              8.262 MB/23.36 MB
docker ps -q returns the list of running container ids, which we then pipe through xargs and into docker stats. Adding --no-stream gives us just the first result instead of continually updating the stats.
It’s a neat little trick. If anyone knows how to make this return container names instead of ids, please comment below.
Again, this is unnecessary for the newest versions. Just run docker stats and you’ll get nearly identical output.
~Semper Cogitet
Go away. It will all be waiting for you when you return.
Posted by Christopher J. McClellan in Life, Programming on June 10, 2017
I realize that my posts here have become a bit infrequent and erratic. If you’re a frequent reader, you know that I changed jobs early this year. I didn’t just change jobs though; I completely swapped stacks. Learning a dozen technologies “overnight” has taken up a lot of the time that I previously dedicated to writing. I also had my first ever speaking engagement in May, just as my wife was finishing up her degree. Needless to say, we’ve been having a very busy year to date. I’ve simply not had the time or mental bandwidth to regularly update this blog. I tried, but I don’t feel like it’s been my best writing.
When I first started writing this blog, I had set myself a goal of one new post a month. That made a ton of sense at the time, but I never revisited that goal to make sure it still made sense. Even with everything else going on in my life, I (quite unintentionally) put pressure on myself to meet that goal. At some point this Spring I realized I couldn’t do it all and let some things slide.
It’s important to know where your limits are. There are only so many hours in a day. We must wisely choose what to do with them. I severely underestimated how much time it would take to prepare a presentation, which is funny, because it was largely about not doing “gut” estimations. I sacrificed time with my family and time writing here in order to share something I felt was important to share. Since then, I’ve been focused on making up for the lost time. In fact, we just got back from a fantastic camping trip.
Burn out is a common theme in software development. For all our talk about creating software at a sustainable pace, many of us are not moving at one. It’s not always our stakeholders and clients pushing us past our limits either. They’re an easy scapegoat, but in many cases, it’s us pushing ourselves past our limits. We’ll go in early, stay late, or log in from home to check on a long running process. We don’t say “no” often enough to though “aggressive” (cough impossible cough) deadlines. That’s our own fault. We’re responsible for our own health and well being. We’re responsible for creating a sustainable pace of development.
How long has it been since you’ve taken a vacation? I mean a real vacation, not a day here or there, or a week where you check your email and Slack five times a day, but one where you leave the laptop at home and shut off your phone for a week. How long has it been? My last one was at least seven years ago. Granted, I may be a workaholic, but that’s about six years too long without a break from it all. Creating software is a massively creative endeavor. How did I expect myself to remain creative without taking time to recharge those creative juices?! I don’t know. I’m some sort of idiot I guess, because I feel better than I have in years. I feel ready to solve problems and inspired to write again.
If it’s been a while since you’ve unplugged, I highly encourage you to do so. Take a few days and pretend it’s 1995. Navigate with a paper map to someplace new and exciting. Go hiking or visit a museum. Spend some extra time with your kids. Whatever recharges you, go do it. You won’t regret it.
~ Semper Cogitet
P.S. This was supposed to be an update about what’s coming up in the next few months, but I seemed to have found something more important to say in the process of writing this post. I do have a few technical posts on my todo list and at some point I intend on turning my Lean Estimates talk into a blog post. They’re coming, but not a huge priority for me at the moment. I’ll write them as time allows, however I have prioritized time with my family and some house hold chores over this blog. I expect to post one new blog about every 6-8 weeks instead of every 4-6. So hang tight while I find a sustainable pace for this blog.
Pretend Your Users Sat Next to You Everyday
Posted by Christopher J. McClellan in Programming on May 13, 2017
I’m very much a “The tests pass. Ship it.” kind of guy. I like to fail fast and have long believed that the best way to find places where we missed a requirement or made a mistake is to get it into the hands of real users as quickly as possible. Recently however, the users are the folks sitting right next to me. I don’t mean a Product Owner either, I mean my team mates, my fellow devs. This has begun to really change my perspective a bit.
You see, we’re not building software. Sure, we are building software, but that piece is inconsequential. What matters is the output of that software, not the software itself. It’s just a means to an end, which also means that we operate the system, we’re its users. The ultimate form of eating your own dog food, if you will.
This means that if I break something, I not only have someone breathing down my neck, but I’ve also directly hurt my team and slowed us down. Obviously, this has given me lots of good reason to slow down and test a bit more thoroughly (manually, exploratorily) than I have in the past. I hope to continue to care this much about my users when they no longer sit right next to me again.
So dear reader, my challenge to you: Don’t treat your users like testers or guinea pigs. Treat them like you’d treat them if they sat next to you, worked with you, everyday. I’m willing to bet you’d delight them that much more.
Until next time,
Semper Cogitet
Two Quick Tips for a Better Code Review Experience
Posted by Christopher J. McClellan in Programming on April 30, 2017
Let’s talk about Code Reviews for a minute. They’re important; they spread knowledge around and catch bugs [citation needed], but they can be frustrating some times. They don’t need to be though. There are a few things we can do to keep the code review a pleasant experience.
- Review the code, not the coder.
Keep it impersonal. Don’t use the words “you”, “your”, etc. Talk about the code. “This foo should handle this edge case.”, not “You forgot to handle this edge case.”
If you feel really compelled to use pronouns, always use “We”. It makes it clear that we both share the responsibility. “We need to handle this edge case here.”
- Don’t just point out flaws, offer improvements.
The most frustrating thing I run into is inactionable comments. “This foo is kind of ugly.” Yes. I know it’s ugly. It’s that way because I don’t know how to clean it up. We’re not learning via the Platonic method here. Please offer some suggestions on how we can clean it up. If I had known how, I would have likely already done so. If you don’t know either, offer to pair on it.
There you go, two quick tips for a better code review experience.
Until next time… Semper Cogitet
Tests tell stories, listen to what they say
Posted by Christopher J. McClellan in Programming on March 20, 2017
I’m not a big fan of integration tests. They’re often unreliable and “flaky” due to their very nature of being integration tests that rely on file systems, networks, and databases. These kinds of tests are hard to get right. At least, it’s hard to get them stable enough to be valuable and I often wonder if the gains outweigh the costs. However, there is one very useful thing integration tests can do for you. They can bring architectural smells to light. Do you need to bring up an entire (virtualized) cluster just to test one small component of your system? That’s a smell. Just like a unit test that needs to setup dozens of fakes, it’s a sign that your system is too tightly coupled.
I was recently working on a dashboarding application that talks to a Lucene based search engine. The QA team had been running their integration tests by spinning up an entire cluster, complete with dozens of other components. This was the only way for them to run the application and get data into it to work with. It takes around 20 minutes to get a local, dockerized, cluster running, so needless to say, I’m looking for ways to run just the parts I need. In other words, I needed to know if I actually needed the entire environment, or if I could just spin up an instance of the search engine for testing purposes.
It turns out that this was a couple of hours of work to create a much smaller docker network with just the search engine, proxy server, and the web app. It turns out that this section of the system is architected pretty well, but you wouldn’t have known it from looking at the tests. Indeed, many other parts of the “distributed monolith” really do need the whole cluster in order to function properly. I suspect that because most of the system requires dozens of components to be online, it was just assumed that this part of the system did too.
Tomorrow, I hope to finish automating those integration tests by whipping up a small docker-compose file and data seed script. This test setup should document exactly what is needed in order for this application to run. As for the tests that require dozens of components to run? Those tests are a testimate to why I’ve begun to lovingly call this system a “distributed monolith”.
Until next time,
Semper Cogitet
Code Review


You must be logged in to post a comment.